Depreciation on Electric SUVs: What the Data Shows
Here is the honest answer first: no depreciation data is published for XPENG in Australia, so any percentage you read online — including percentages in this article — is a model, not a measurement. What is published is the set of terms that tend to protect value: an 8-year or 160,000 km key parts warranty covering the traction battery and drive motor, a published floor of 70% of original battery capacity during that period, and 7 years of roadside assistance from first registration.
Key takeaways
- No resale or depreciation figures are published for Australia, so treat every percentage as a modelling assumption.
- The published key parts warranty runs 8 years or 160,000 km, covering the traction battery, BMS, drive motor and IPU.
- The traction battery warranty provides a minimum of 70% of original capacity during the key parts period, with gradual reduction described as normal.
- The Xmart OS cockpit is OTA-upgradable, so the software a used buyer inspects can be newer than the car's build date.
What the manufacturer actually publishes
Start with the documents that a second buyer will ask to see, because those are the ones that survive the first owner. Whole vehicle cover runs 7 years or unlimited kilometres for private use, and 7 years or 160,000 km for commercial use, whichever occurs first. Key parts cover runs 8 years or 160,000 km and includes the traction battery, the battery management system, the drive motor and the intelligent power unit. Paint is covered for 5 years or unlimited kilometres, anti-corrosion for 7 years or unlimited kilometres, and roadside assistance runs for 7 years from first registration.
The terms apply to vehicles imported into Australia by the official importer and registered here, and conditions and exclusions sit in the Warranty and Maintenance Manual. For a resale conversation, that is the paperwork that does the talking — not the colour of the paint or the size of the wheels.
What is not published, and why that matters
There is no published depreciation curve, no published resale guide and no published price list for the Australian range. That absence is not unusual, but it changes how a buyer should read a headline like "electric cars lose X% in year one". Those figures come from models built on assumptions about supply, demand and incentives in other markets, and they are weakest exactly where a buyer needs them most: at the five-year mark, on a specific model, in a specific city.
The practical response is to build your own index and keep it honest. Use percentage assumptions you can defend, apply them consistently, and change one variable at a time so you can see which assumption is actually driving the answer.
The published terms that carry into later years
| Published item | Term |
|---|---|
| Whole vehicle warranty, private use | 7 years / unlimited km |
| Key parts warranty (traction battery, BMS, drive motor, IPU) | 8 years / 160,000 km |
| Battery capacity floor during the key parts period | Minimum 70% of original capacity |
| Roadside assistance | 7 years from first registration |
| Scheduled service interval | 12 months or 20,000 km, whichever comes first |
| Cockpit software | Xmart OS, OTA-upgradable over Wi-Fi or mobile network |
Why the battery floor is the number to read twice
Range is the specification an elctric suv buyer tests first, and capacity is what determines it. The published promise is a minimum of 70% of the battery's original capacity during the key parts period, and the same page notes that gradual capacity reduction is normal for traction batteries — a useful sentence, because it sets expectations instead of pretending batteries do not age. A car that has spent five years on a slow home charger in a mild climate will usually sit above that floor, while a car that has lived on public fast chargers in extreme heat will be nearer to it.
For an owner, that makes charging habits part of the resale story. Frequent 10–80% sessions on a fast charger are published at 12 minutes on the 5C battery, which is impressive, but daily use does not require them: a home charging schedule overnight does less thermal work and is cheaper per kilowatt-hour as well.
Worked example: five years on an index instead of dollars
Because no prices are published, this example uses an index rather than money: the car starts at 100 units at delivery and the units represent relative value, not currency. Assumptions are stated and are deliberately conservative. Scenario one assumes 18% in the first year and 10% a year after that. Scenario two assumes 12% in the first year and 8% a year after that.
Scenario one, year by year. Year 1: 100 × 0.82 = 82.0. Year 2: 82.0 × 0.90 = 73.8. Year 3: 73.8 × 0.90 = 66.4. Year 4: 66.4 × 0.90 = 59.8. Year 5: 59.8 × 0.90 = 53.8. So the car retains about 54 units of the original 100, a loss of 46.2 units over five years.
Scenario two, on the gentler assumptions. Year 1: 100 × 0.88 = 88.0. Year 2: 88.0 × 0.92 = 81.0. Year 3: 81.0 × 0.92 = 74.5. Year 4: 74.5 × 0.92 = 68.6. Year 5: 68.6 × 0.92 = 63.1. The difference between the two scenarios is 63.1 − 53.8 = 9.3 units, or about nine percentage points of the original value, produced purely by changing two assumptions. That gap is why depreciation articles should be read as scenarios rather than predictions.
Now the battery side as a second, separate calculation. Assume 2% capacity loss a year, which is an assumption, not a published figure. Over five years: 5 × 2 = 10 percentage points of capacity, so 100 − 10 = 90% capacity remaining. That sits well above the published 70% floor, which is the comparison a used buyer will actually make when they ask to see a state-of-health reading.
Why range and charging figures belong in a resale article
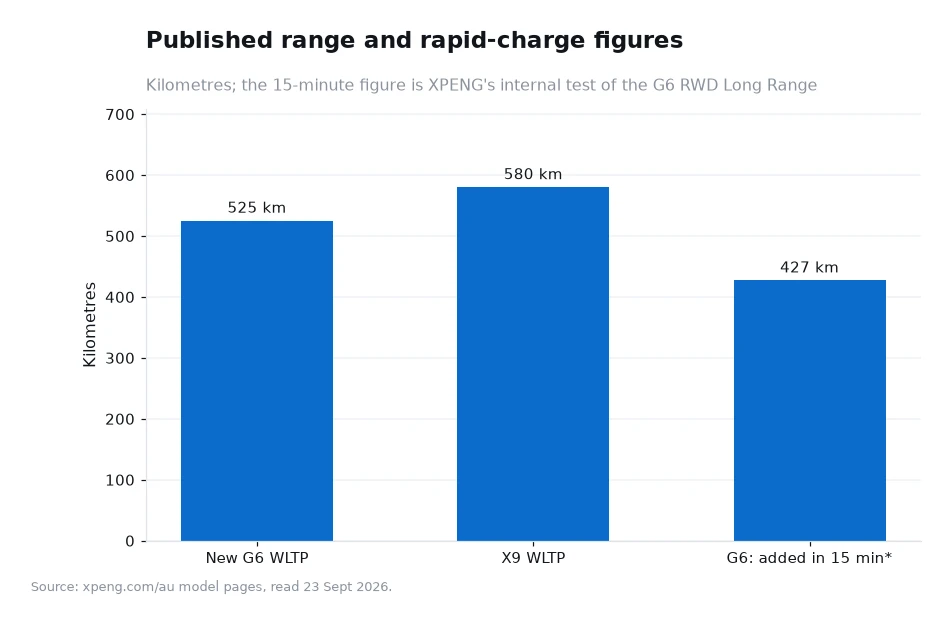
Because they are what a second buyer compares between one used car and another. The chart below carries the published figures that do the work in that comparison: 525 km of WLTP range for the New G6, 580 km for the X9, and up to 427 km added in 15 minutes from XPENG's internal test of the G6 RWD Long Range. A car whose software has been updated and whose battery sits near the top of its health range presents better than an identical car that has been fast-charged daily and serviced late.
Brand momentum matters too, and it is published on the brand's news page. The most recent Australian updates describe an Australia strategy with Navigation Guided Pilot in 2027, five new models in 2026 and a growing sales and service network, alongside group results that put gross margin at 20.7% in Q2 2026 with overseas markets driving 25% of first-half revenue. None of that promises anything about resale, but a brand that keeps investing in a market makes for a calmer ownership story than one that does not.
Frequently asked questions
Do electric SUVs really lose value faster than petrol cars?
No published Australian depreciation data covers this range, so the fair answer is that any comparison you read rests on the writer's assumptions; what is published here are coverage terms, a 70% battery capacity floor and over-the-air software updates.
What single habit protects resale value most?
Keep the service record complete at the published 12-month or 20,000 km interval, because a documented history and a healthy battery reading are the two things a used buyer can verify without taking the car apart.
How to use this without fooling yourself
Write your own index on a single sheet: a starting value of 100, one assumption for year one, one for the years after, and a battery assumption. Then change one number at a time and watch how much the five-year figure moves. If it moves by ten points when you shift an assumption by six, the model is doing the work, not the market.
Keep the paperwork in one folder — service invoices, software update history and any warranty correspondence — and read the warranty terms once properly rather than skimming them at handover. Ten minutes with the manual now saves an argument in five years.
Warranty terms, the 70% capacity floor and the range figures come from the manufacturer's Australian site at xpeng.com/au, read 23 Sept 2026, including the note that gradual battery capacity reduction is normal and that WLTP range depends on conditions. The 18%, 12%, 10%, 8% and 2% annual assumptions and the 100-unit index are illustrative modelling, not published data.[1]